UNEP: Humanity is still ‘breaking all the wrong records’ in fast-warming world


Zeke Hausfather
11.20.23Zeke Hausfather
20.11.2023 | 2:00pmThe world “must change track”, warns the latest “emissions gap” report from the UN Environment Programme (UNEP).
If it fails to do so, adds the increasingly exasperated UN agency, “we will be saying the same thing next year – and the year after, and the year after, like a broken record”.
The report, which is the latest in a regular series published annually since 2013, charts the “gap” between where emissions are headed under current policies and commitments over the coming decade compared to what is needed to meet the Paris Agreement goal of limiting global warming to “well below” 2C and pursuing efforts to stay under 1.5C.
It highlights both the record-breaking temperatures of 2023 and the record levels of greenhouse gas emissions, noting that “humanity is breaking all the wrong records when it comes to climate change…yet the world fails to cut emissions (again)”.
The report provides an assessment of global action on climate change over the past year. It finds that, while there has been some progress both in stronger climate policies and the falling costs of low-carbon energy, the world remains on track for around 2.7C warming by 2100.
The world is also getting close to passing the 1.5C “aspirational” target of the Paris Agreement, says the report, with the vanishingly small remaining carbon budget for 1.5C and the fact that 2023 has already seen more than 86 days exceeding 1.5C above preindustrial levels.
While the Paris Agreement’s 1.5C target refers to multidecadal average temperatures, the fact that the world is already occasionally exceeding it is a “signal that we are getting closer”.
COP28, which starts next week in Dubai, will mark the conclusion of the first global stocktake under the Paris Agreement and set the scene for the next round of climate pledges by nations, known as nationally determined contributions (NDCs).
The UNEP report concludes that the possibility of meeting the Paris temperature target now hinges on “relentlessly strengthening” mitigation measures this decade and narrowing the emissions gap.
(For previous reports, see Carbon Brief’s detailed coverage in 2014, 2015, 2016, 2017, 2018, 2019, 2020, 2021 and 2022).
Continued rise in greenhouse gas emissions
Despite falling clean-energy costs and more ambitious climate policies adopted by some countries, global greenhouse gas emissions increased by 1.2% from 2021 to 2022, setting a new all-time record of 57.4 gigatonnes of carbon dioxide equivalent (GtCO2e).
This reflects a full rebound of global emissions from the declines seen during the Covid-19 pandemic (with the exception of the transportation sector).
The figure below shows global GHG emissions between 1990 and 2022, broken down by different contributing greenhouse gases. Overall GHG emissions have grown by 44% over the past 32 years, though the rate of growth has been slower over the past decade than over the 1990s and 2000s.
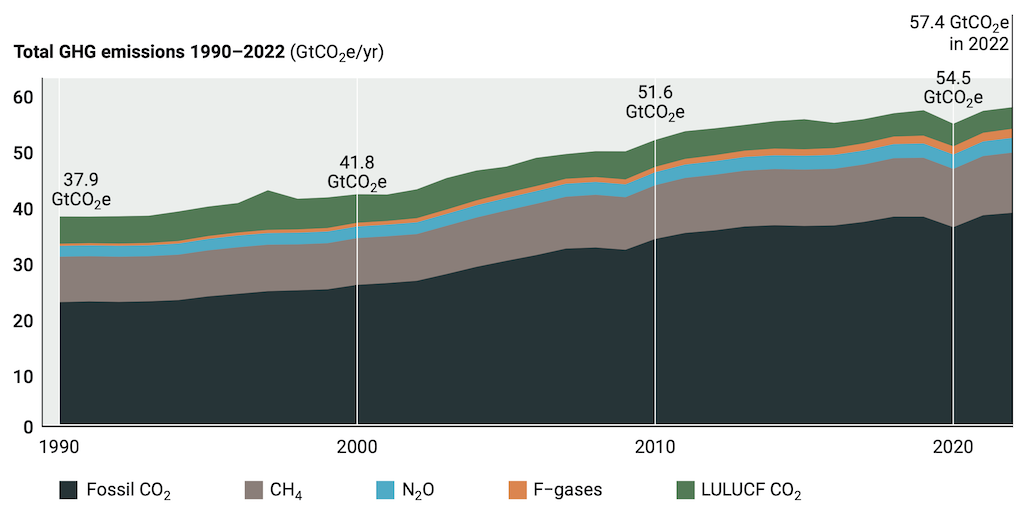
CO2 from fossil fuels is the main driver of the increase and is responsible for around two-thirds of current global GHG emissions.
Emissions of methane, nitrous oxide and fluorinated gases account for around a quarter, with the remainder from land-use change (e.g. deforestation).
The growth of fossil-fuel emissions has been accompanied by increased investments in fossil-fuel extraction worldwide.
The UNEP report notes that governments are currently planning to produce more than double the amount of fossil fuels in 2030 than would be possible in a pathway consistent with limiting warming to well-below 2C.
The report also takes stock of current GHG emissions broken down by country, both on a total and per-capita basis. The figure below shows both 2021 emissions by country and the change in emissions since 2000 across both metrics.
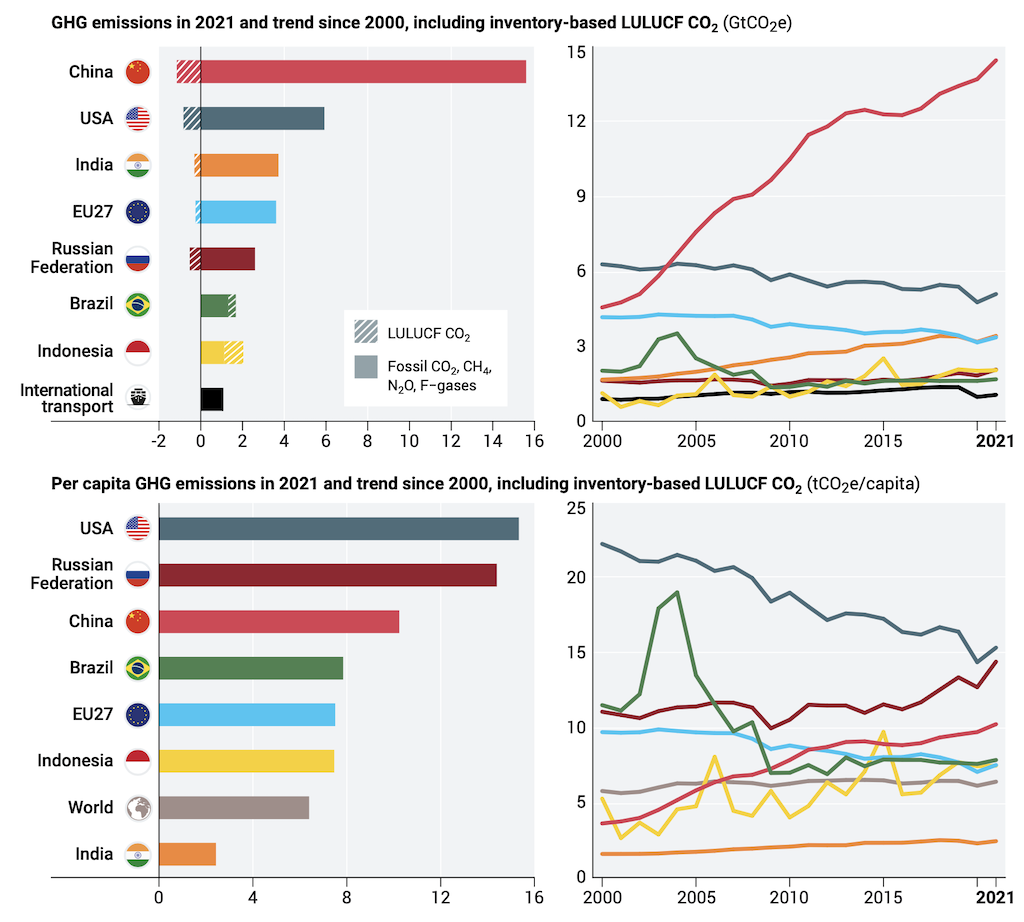
This reveals the complicated nature of GHG emissions; while some countries such as India have large absolute emissions, their per-capita emissions remain a small fraction of those of the US, China, or Europe. At the same time, emerging economies such as China and Brazil now emit more on a per-capita basis than the EU. Emissions have been rapidly growing in China, Russia and Indonesia, but are declining over time in the US, EU and Brazil.
However, the changes to the climate that the world has experienced to date are a result of our historic cumulative emissions rather than the emissions of the past few years.
The figure below shows the historical cumulative CO2 emissions by country, the contribution to historical warming from GHG emissions, the current GHG emissions, plus the current population.
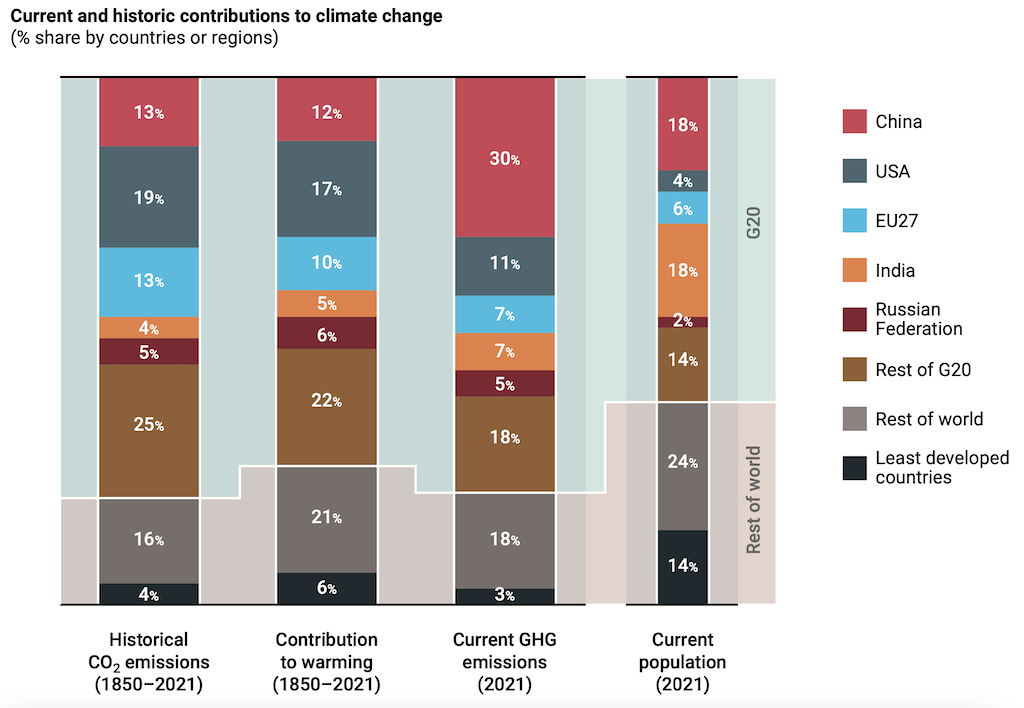
While China is responsible for more GHG emissions today than any other country, it is still responsible for less warming to-date than the US (and only slightly more than the EU).
While this may change in the future if Chinese emissions do not decline, it reflects the fact that high-income countries remain responsible for an outsized portion of the warming the world is experiencing today.
The least developed countries, by contrast, are only responsible for 6% of current warming and 3% of current GHG emissions, despite representing 14% of the global population.
As the report notes, meeting Paris Agreement goals requires that high-income countries accelerate domestic emissions reductions and reach net-zero “sooner than the global average”, while providing support to help low- and middle-income countries meet their climate goals.
The report also calls out the importance of meeting pressing development needs in lower-income countries “alongside a transition away from fossil fuels”.
A persistently wide emissions gap
Only nine countries have submitted new or updated nationally determined contributions (NDCs) under the Paris Agreement over the past year, though 149 countries have since the 2015 Paris Agreement.
As the report notes, “progress since the Paris Agreement was signed in 2015 has shown that the world is capable of change”, with future greenhouse gas emissions projected to only increase 3% by 2030 compared to 16% when the Paris Agreement was first struck.
While these NDCs – alongside other policies enacted by countries – have helped move the world away from some of the darkest climate futures that seemed plausible a decade ago, a large gap remains between the pathway the world is on today and what would be required to put the world on a path to meet its Paris Agreement targets.
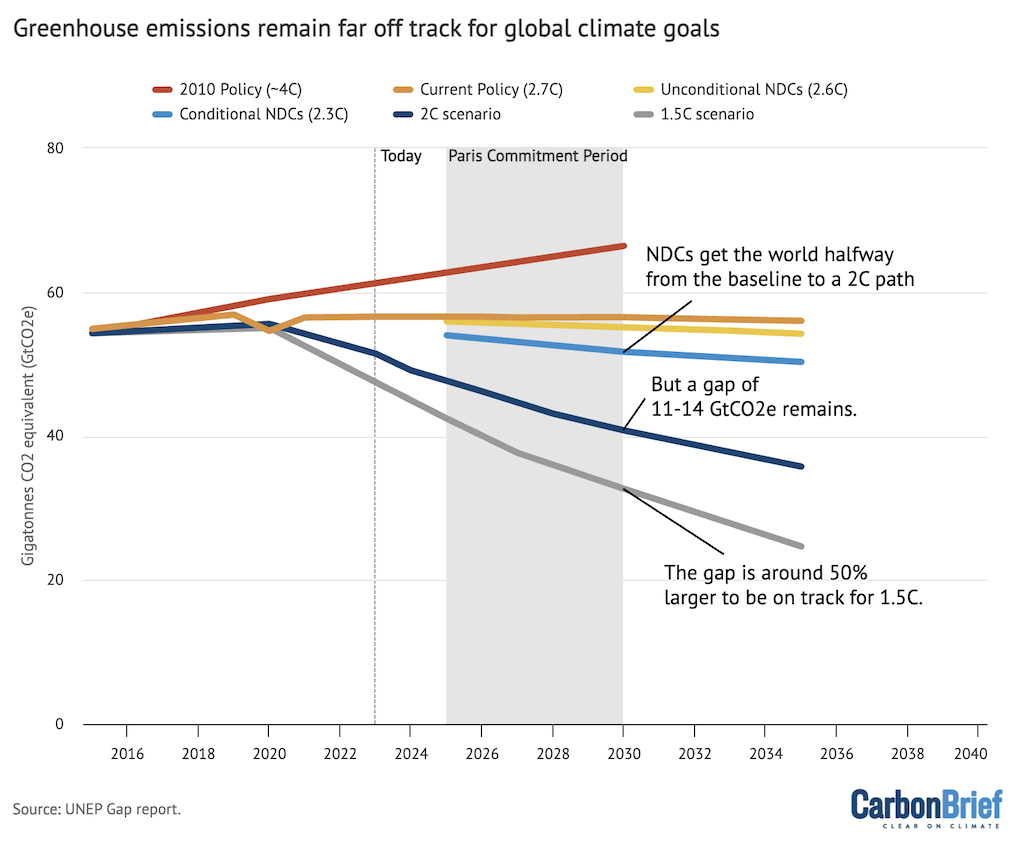
The report finds an emissions gap in 2030 of around 14GtCO2e between where the world is headed if countries achieve their “unconditional” NDCs (that is, those not conditioned on “green finance” or other external assistance) – shown by the yellow line – and an emissions pathway that limits warming to below 2C (defined in the report as a >66% chance of avoiding 2C warming) – shown by as the dark blue line.
The gap is even larger – around 22GtCO2e – between unconditional NDCs and a scenario consistent with limiting warming to 1.5C by the end of the century (grey line). If conditional NDCs are fully implemented in addition to unconditional ones (light blue line), this emissions gap would shrink by around 3GtCO2e through to 2030 for both the 2C and 1.5C scenarios.
However, countries are not necessarily even on track to meet their NDCs. The report suggests that a number of countries – including Australia, Brazil, Canada, the EU, Japan, Korea, the UK and US – are unlikely to meet their targets with existing policies in place today.
The emissions gap has shrunk slightly – by 1GtCO2e – across all scenarios since the prior 2022 UNEP report. The report also notes that the current policy pathway is now closer to that of unconditional NDCs than in last year’s report, reflecting some progress in countries adopting policies to get closer to achieving NDCs.
The report has also updated the global temperature outcomes associated with current policies and different levels of future climate commitments – including meeting unconditional NDCs, conditional NDCs and fully achieving ambitious net-zero pledges (which, the report notes, few if any countries are on track to achieve today). The figure below compares these estimates between the 2022 and 2023 versions of the UNEP report.
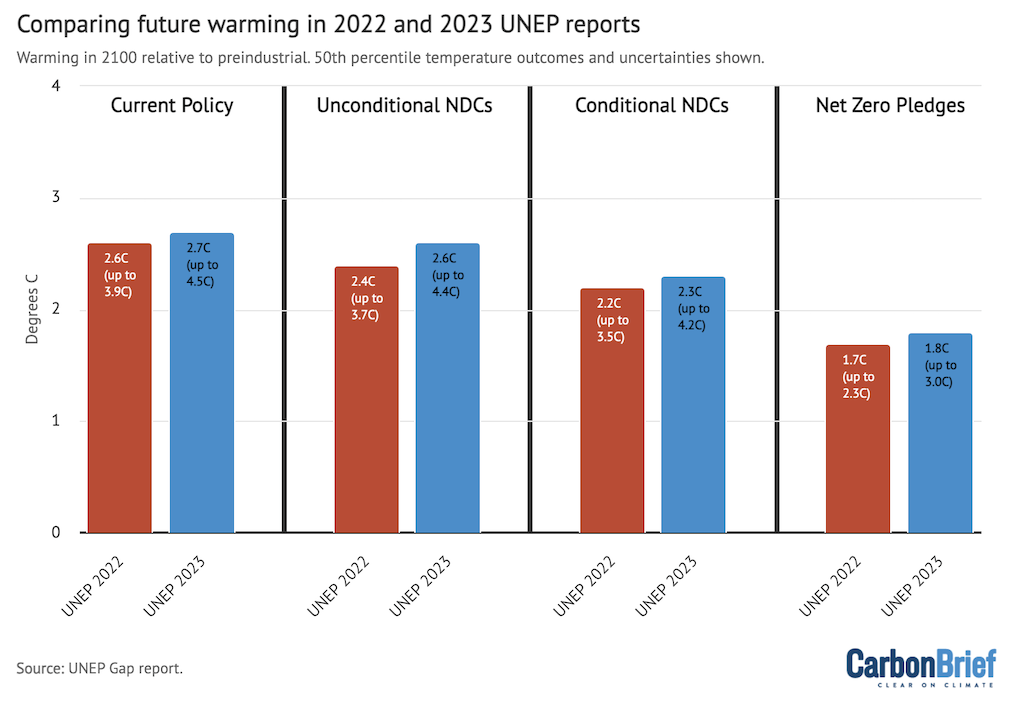
While temperature outcomes are slightly higher in the 2023 report than the 2022 one for each mitigation scenario, these represent changes to the UNEP modelling framework rather than retrenchment or weakening of commitments by countries.
Grappling with current policy uncertainty
There has been increasing interest in the scientific community in recent years in exploring current policy pathways – what is likely to happen both to emissions and 21st century warming under policies in place today.
This has always represented something of a challenging exercise, both because determining emissions implied by current policies is inherently uncertain and because it represents a moving target in a world where countries are increasingly adopting more ambitious climate policies. As such, the range of future warming projected under current policies has moved noticeably downward over the past few years.
When determining future warming associated with current policy, modellers have to account for two different uncertainties: what range of future emissions might occur under current policies; and how the climate might respond to those emissions (as determined by climate sensitivity and carbon cycle feedbacks).
The new UNEP report takes an important step in more clearly exploring the range of possible current policy outcomes that might occur. It also emphasises that, while we tend to focus on a single central outcome (e.g. 2.4C in the new IEA World Energy Outlook and 2.7C in this new UNEP report), these numbers mask a huge amount of uncertainty.
The figure below shows both the range of climate outcomes under the best estimate of future emissions for current policies, unconditional NDCs, and net-zero pledges (bars), as well as the maximum and minimum emissions projection consistent with those scenarios.
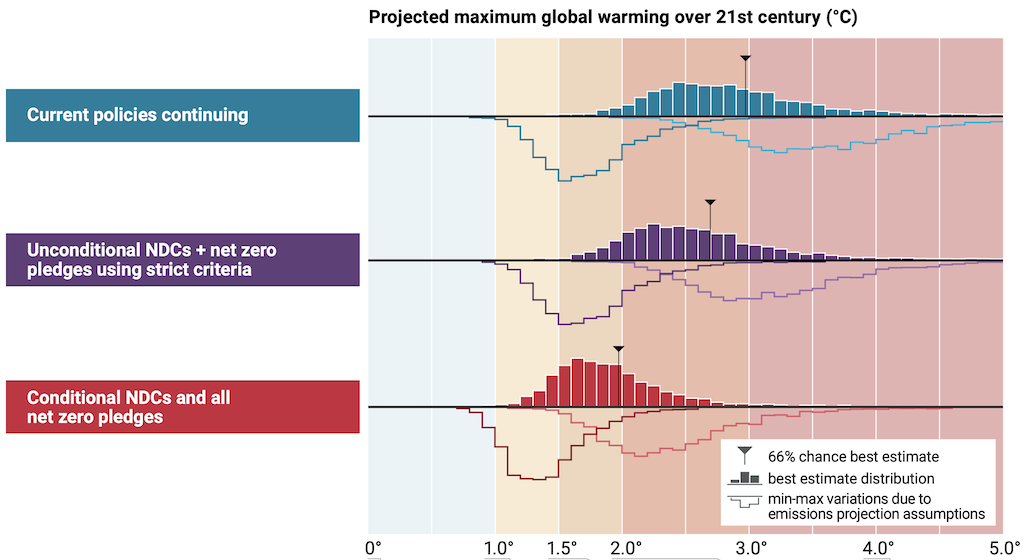
This illustrates that, while 4C warming is extremely unlikely under the central estimate of current policy emissions, it is much harder to rule it out under the range of possible emissions in a current policy world.
In other words, future emissions under current policies (as well as NDCs) remain poorly constrained, particularly in the latter part of the century, and it is important not to underestimate the risks of higher emissions futures if the pace of mitigation is not accelerated.
The rapidly shrinking carbon budget
There is a relatively small amount of allowable carbon emissions – known as the “carbon budget” – remaining for warming to be limited to 1.5C.
As of the start of 2023, there is only around 250GtCO2 – or approximately six years of current emissions – remaining that can be emitted before the world has a 50-50 chance of exceeding 1.5C warming. This represents a notable reduction from the carbon budget assessed in the prior UNEP report, reflecting a recent downward reassessment in the literature.
While this carbon budget can, in theory, be expanded through the widespread use of carbon dioxide removal (CDR) later in the century – as occurs in the 1.5C scenarios in the recent IPCC 6th Assessment Report – these technologies remain relatively nascent and expensive.
The figure below shows emission trajectories to limit warming to below 1.5C with a 50-50 chance in the absence of net-negative emissions. The different lines show the emissions reductions that would be required if emissions had peaked in each year, between 2000 and 2030, with the current year (2023) highlighted in grey.
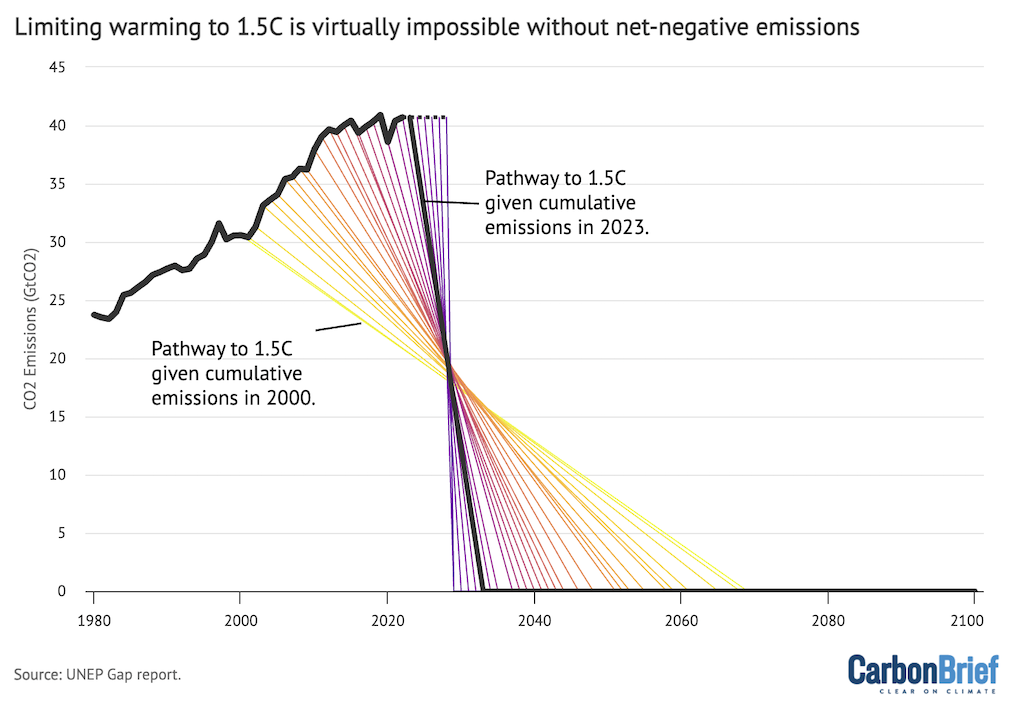
If emissions had peaked and begun to decline after 2000, the 1.5C target would have been much easier to achieve, only requiring reductions of around 3% per year.
By contrast, limiting warming to below 1.5C starting in 2023, without the use of net-negative global emissions, would require a roughly 18% cut each year through to 2033.
Each year that passes without global emission reductions puts the 1.5C target further out of reach, says the UNEP report. While the Paris Agreement’s “well below” 2C target is easier to achieve than 1.5C, delays will make it increasingly difficult, too.
Carbon Brief’s interactive chart below shows the emission reductions needed, by peaking year, to meet the 2C target without the use of net-negative emissions.
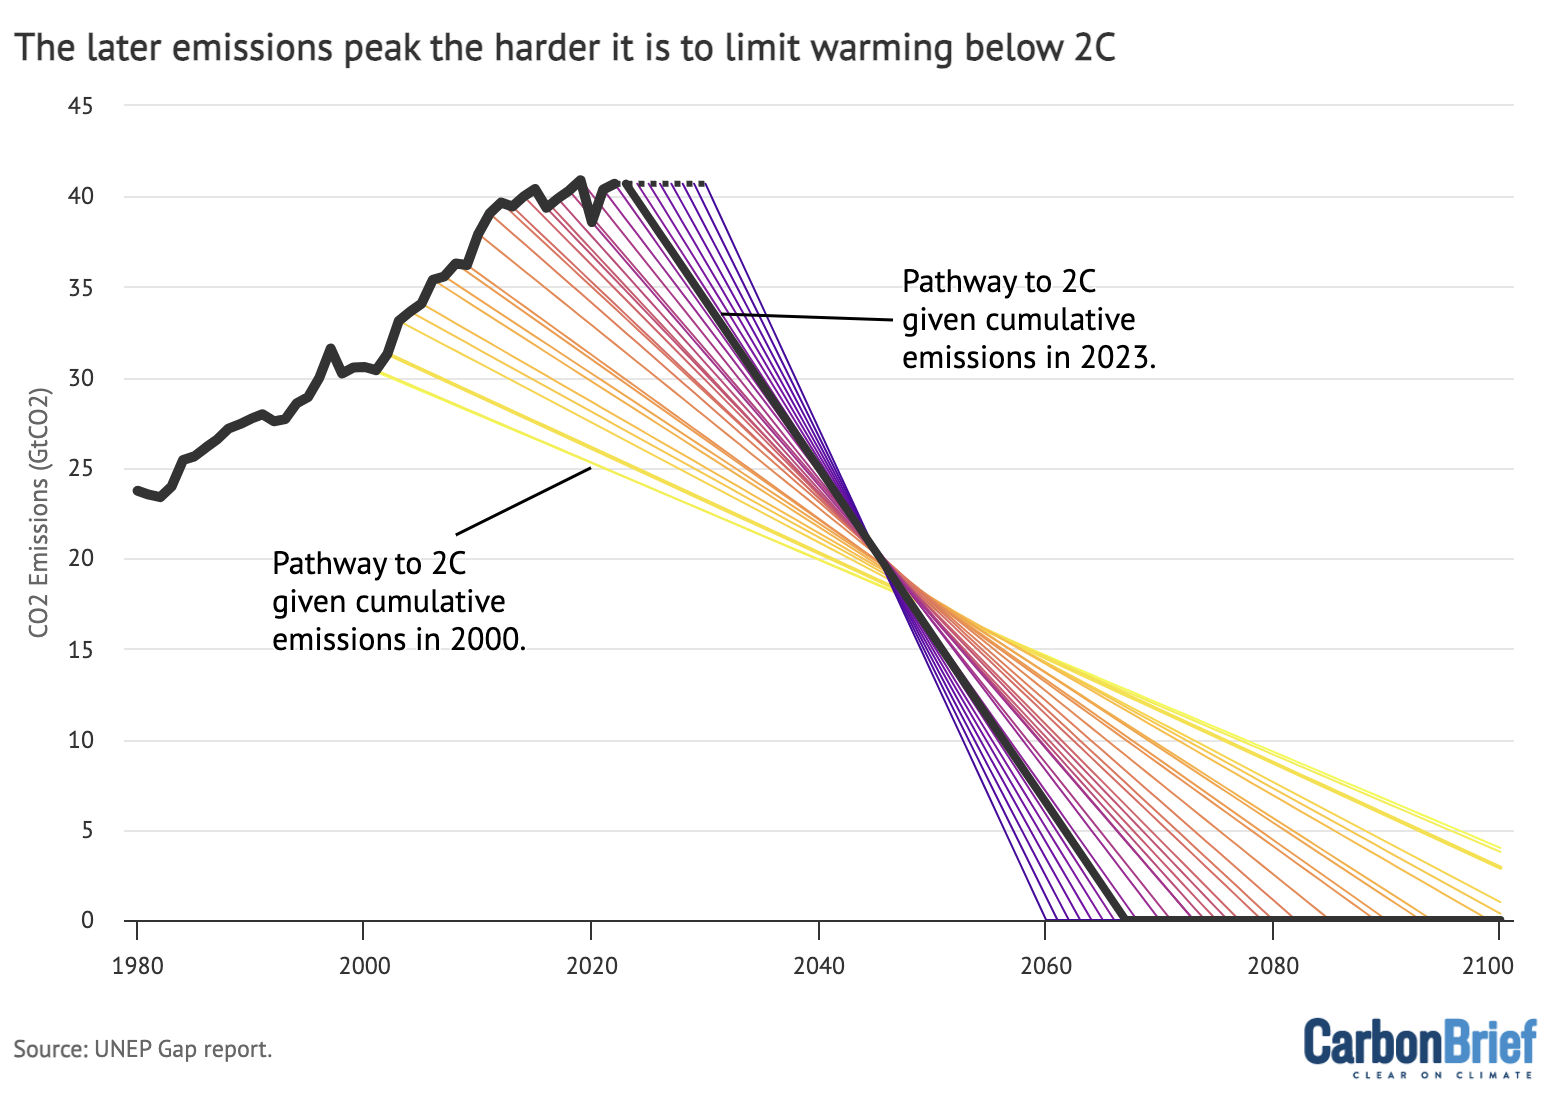
If the world had started reducing emissions in the year 2000, emissions would have to fall 1% a year to stay below 2C (with a >66% chance).
From 2023, emissions now need to fall 4% a year to stay below 2C – and, if emissions fail to drop, then the 2C carbon budget will be used up within 22 years.
It is worth noting that the remaining carbon budget for 1.5C will be fully exhausted simply by the existing infrastructure in place today, as will most of the remaining budget for 2C.
The figure below shows the emissions commitment associated with both existing extraction infrastructure (coal mines and gas and oil wells), as well as by the existing consuming infrastructure (e.g. everything that uses fossil fuels today).
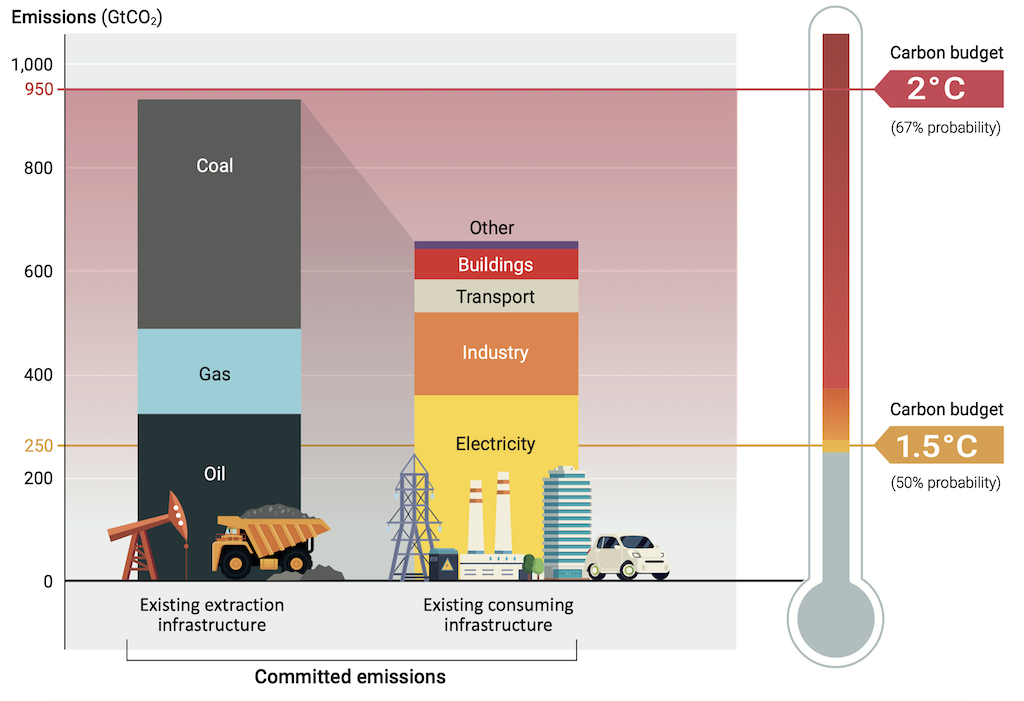
As the report notes, achieving our climate targets requires that much of the existing capital stock will need “to be retired early, retrofitted with carbon capture, and/or operated below capacity”. It also stresses that there is no room for new fossil fuel infrastructure globally unless an even greater quantity of existing fossil infrastructure is prematurely retired.
Every year of delay increases dependence on future CO2 removal
For the first time, the UNEP report contains a dedicated chapter on carbon dioxide removal technologies, reflecting the increased likelihood that the world will “overshoot” its most ambitious climate goals and require net-negative emissions to reduce global temperatures in the latter half of the 21st century.
As the report notes, any delay in emissions reductions will “likely increase future dependence on carbon dioxide removal from the atmosphere”. However, it warns that “the availability of large-scale CDR options in the future cannot be taken for granted” given the early stage and high cost of many of these technologies.
The figure below shows the report’s assessment of the feasibility, scalability, ease of monitoring, reporting and verification (MRV), potential environmental consequences, public perception and cost of a wide range of carbon removal technologies under development or actively deployed today. It also includes an assessment of the “permanence” of each, which is important in determining how effective they can be at effectively reversing the warming associated with CO2 emissions over the long term.
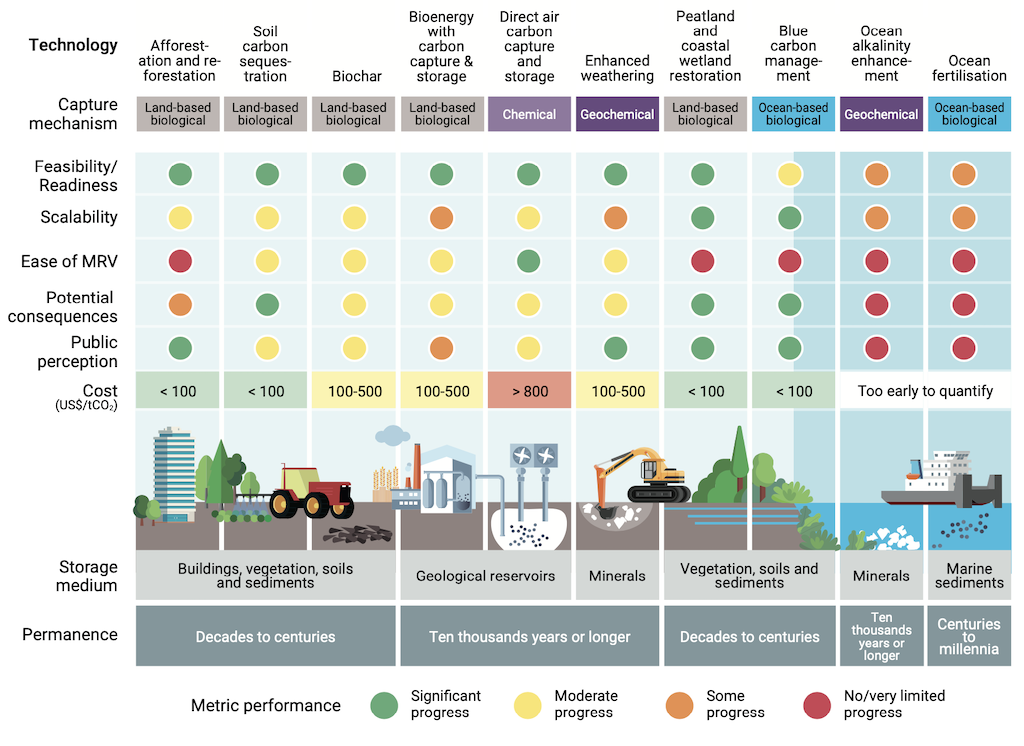
The report notes that relying on large-scale CDR to reduce global temperatures in the future involves significant risks to biodiversity, water resources, food security and livelihoods. Even a relatively short period of “overshoot” of global temperatures is associated with significant risks.


Dr Simon Evans, Carbon Brief’s deputy editor and senior policy editor, is an observer of the UNEP gap report’s steering committee.
-
UNEP: Humanity is still ‘breaking all the wrong records’ in fast-warming world